

Only team admins can open this tab.
Filters and Export
Views
Use the View dropdown, then Apply.
Token tables show Input and Output. Tool-call tables show Tool Calls and Avg Tokens/Call.
Summary
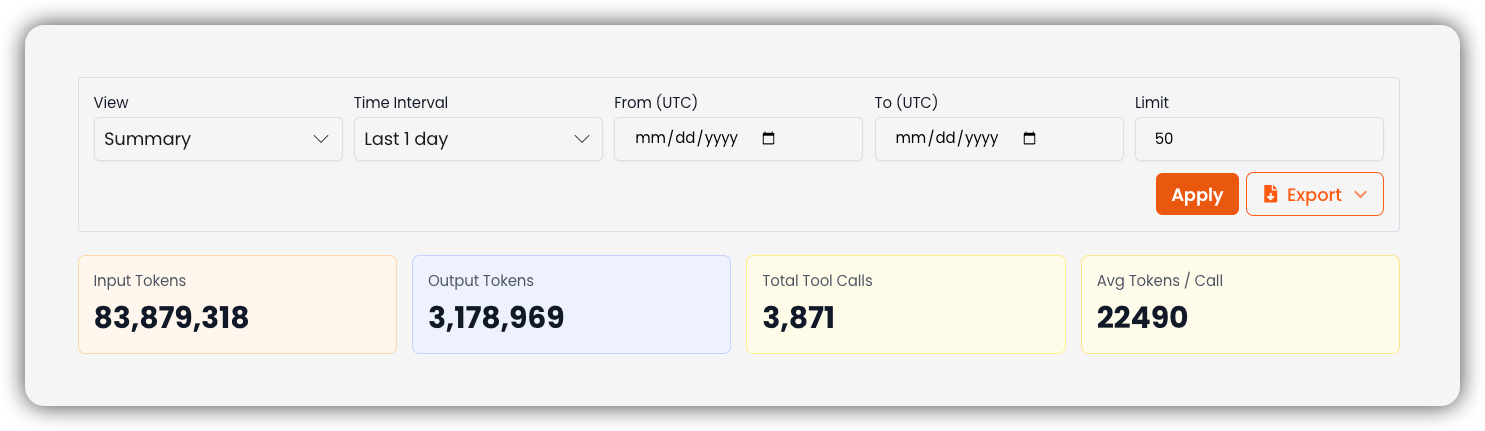
Tokens by Model
Tokens by Model (Pie) shows the share of total tokens per model (top models plus Others). By Model lists each model with input and output tokens.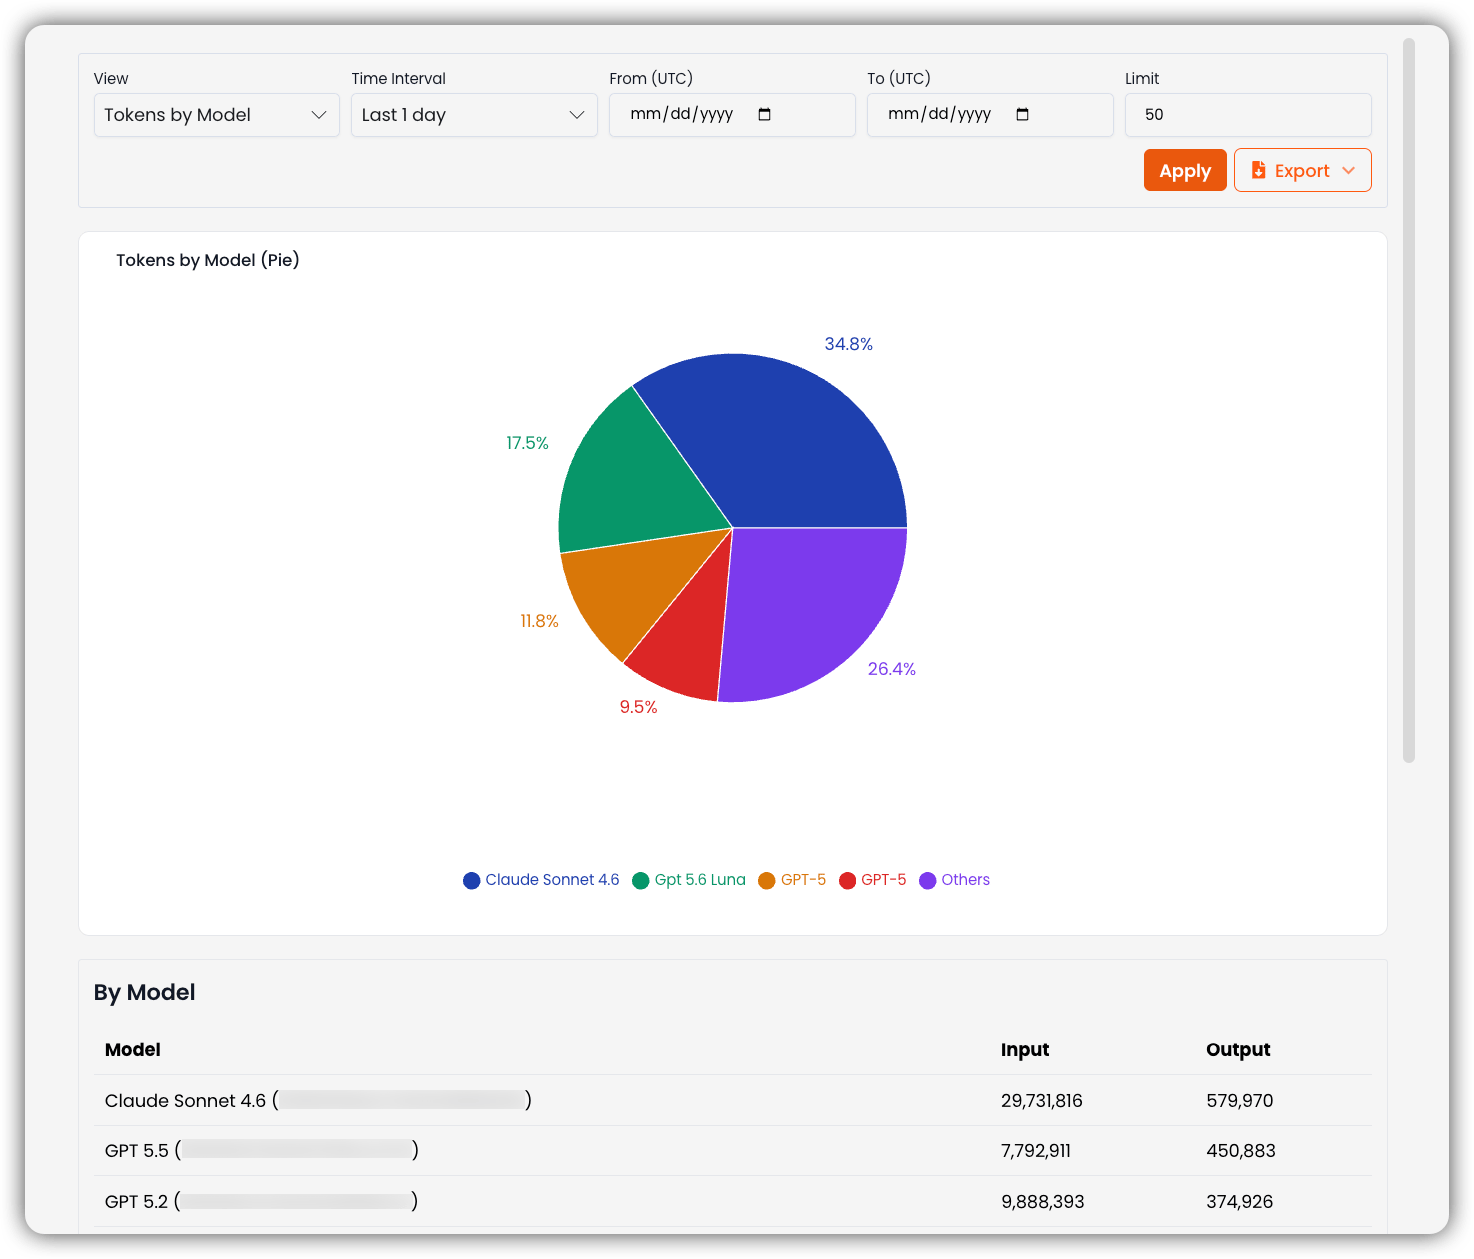
Tokens by Project
Top Projects by Input Tokens and Top Projects by Output Tokens rank projects for the period. Scroll for the By Project table (project, input, output).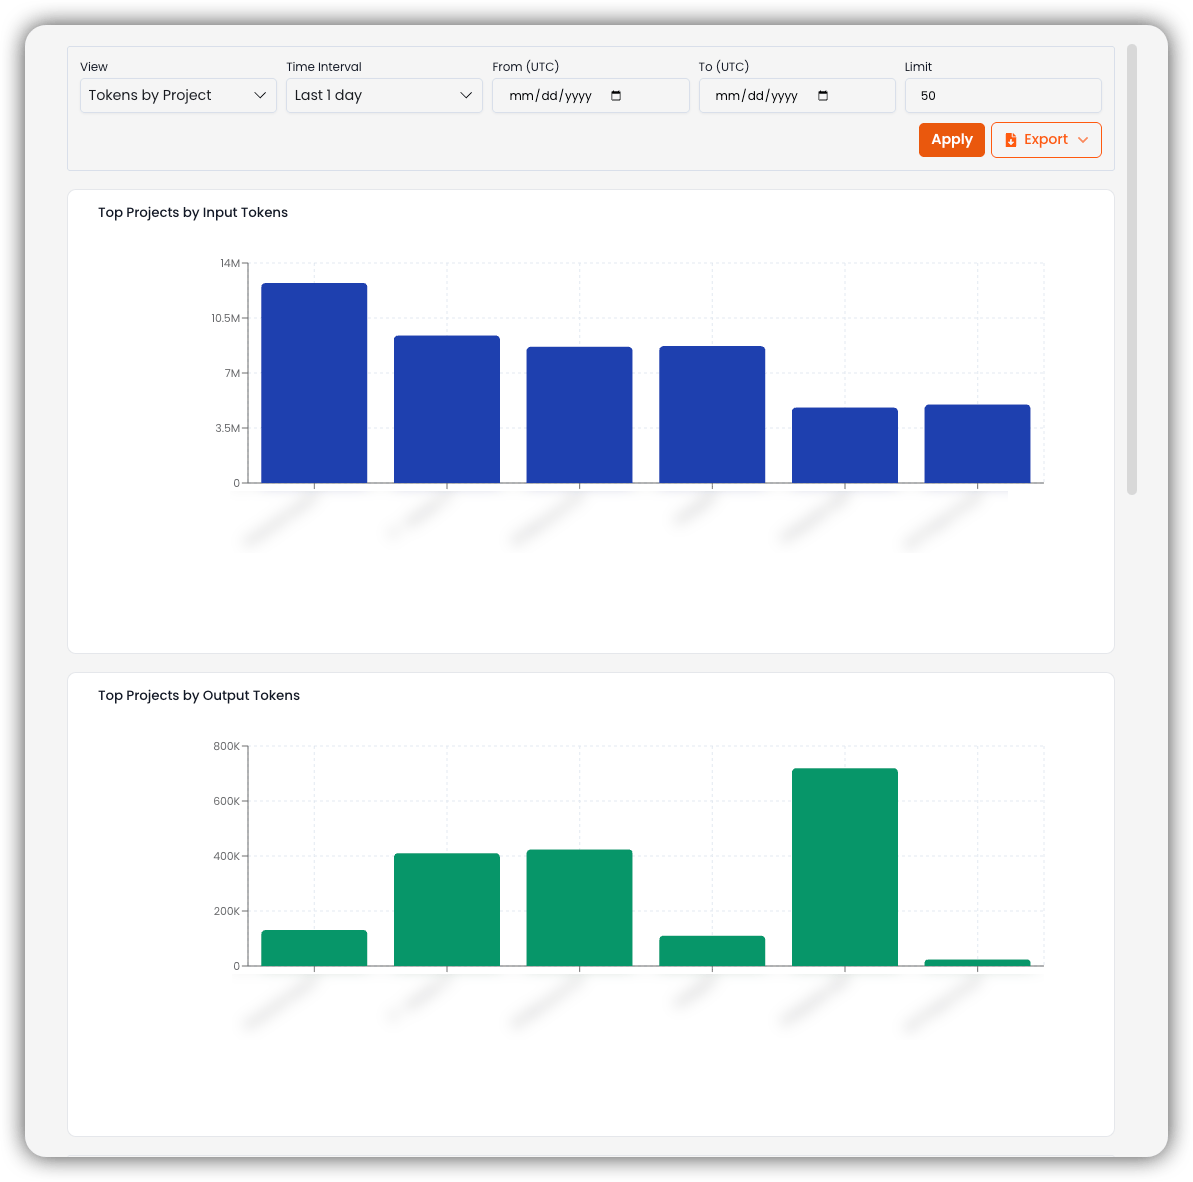
Tokens by Agent
By Agent lists input and output tokens per agent.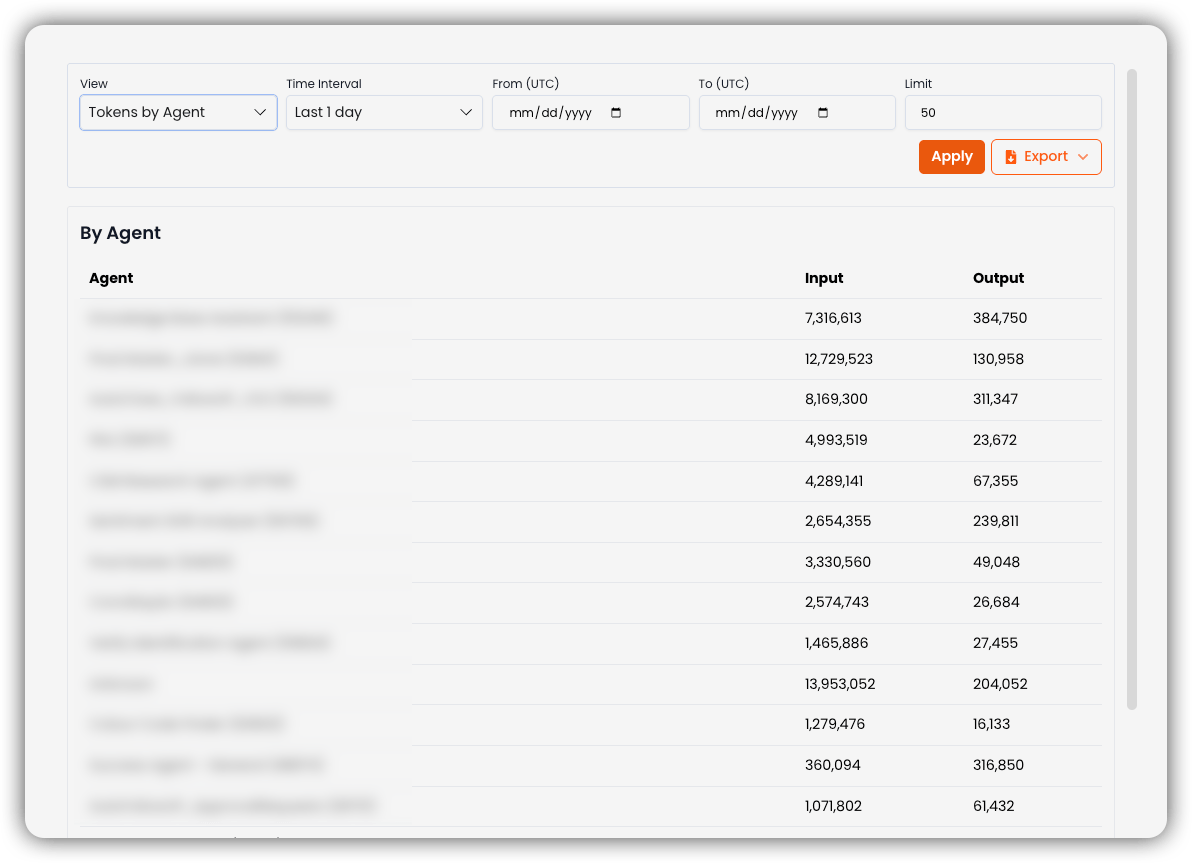
Tokens by User
By User lists input and output tokens per team member.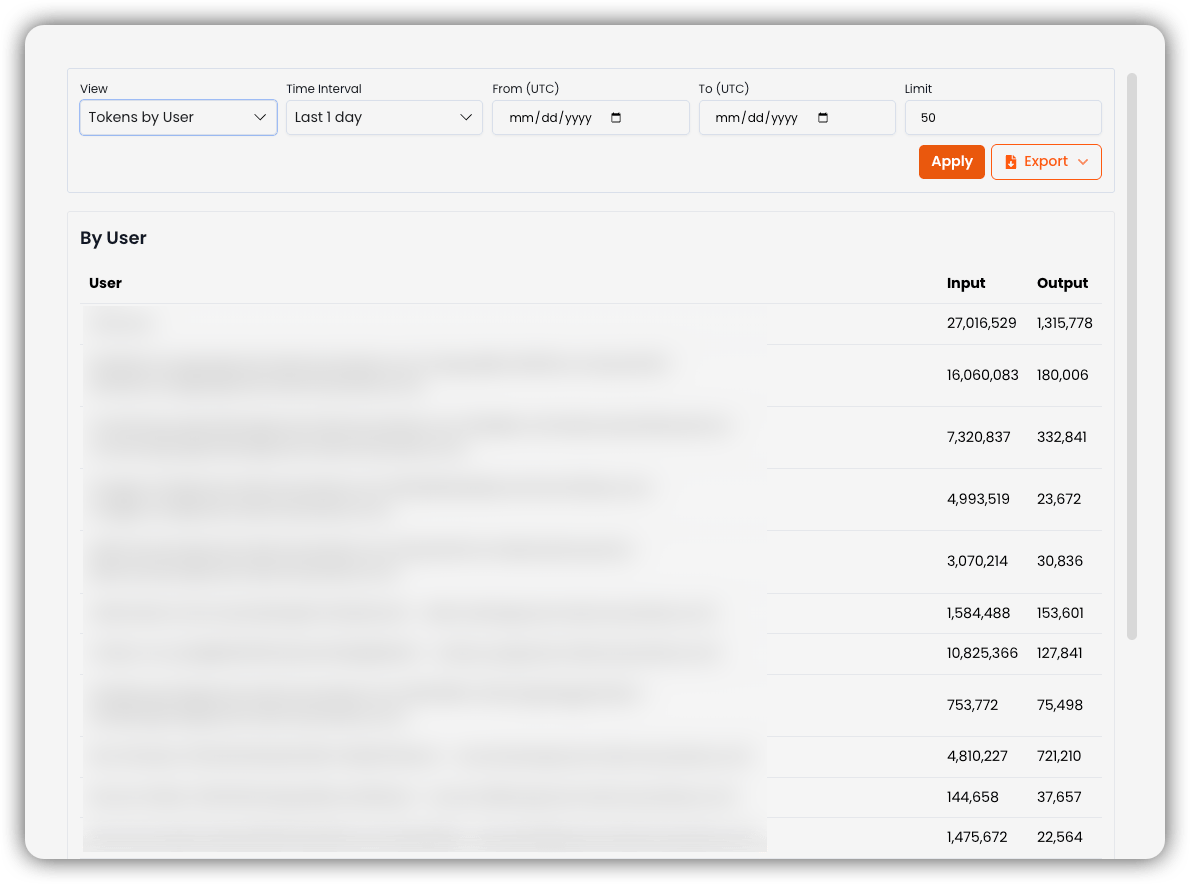
Tokens by Medium
By Medium splits tokens by how the request ran (for example UI and API).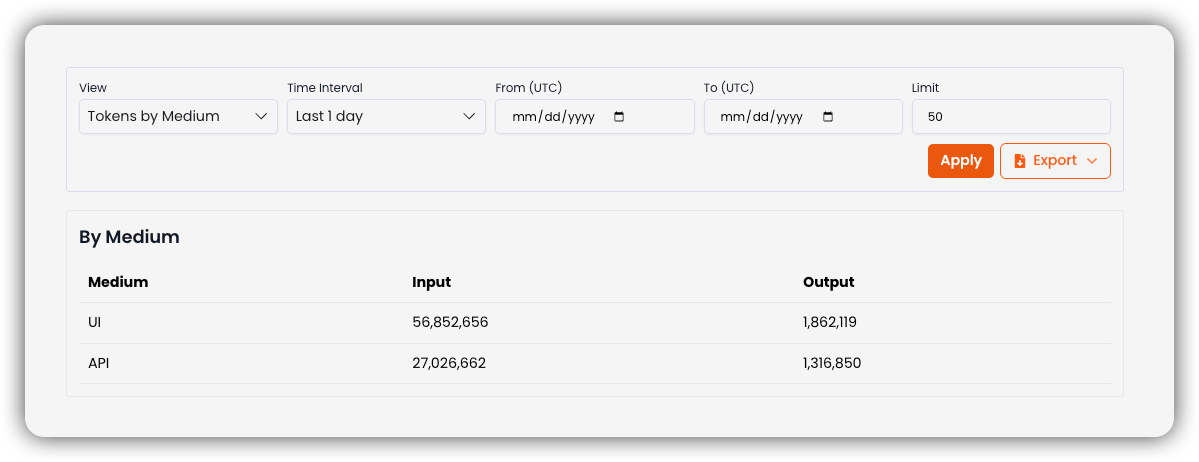
Tool Calls by Project
Tool Calls by Project lists each project with Tool Calls and Avg Tokens/Call.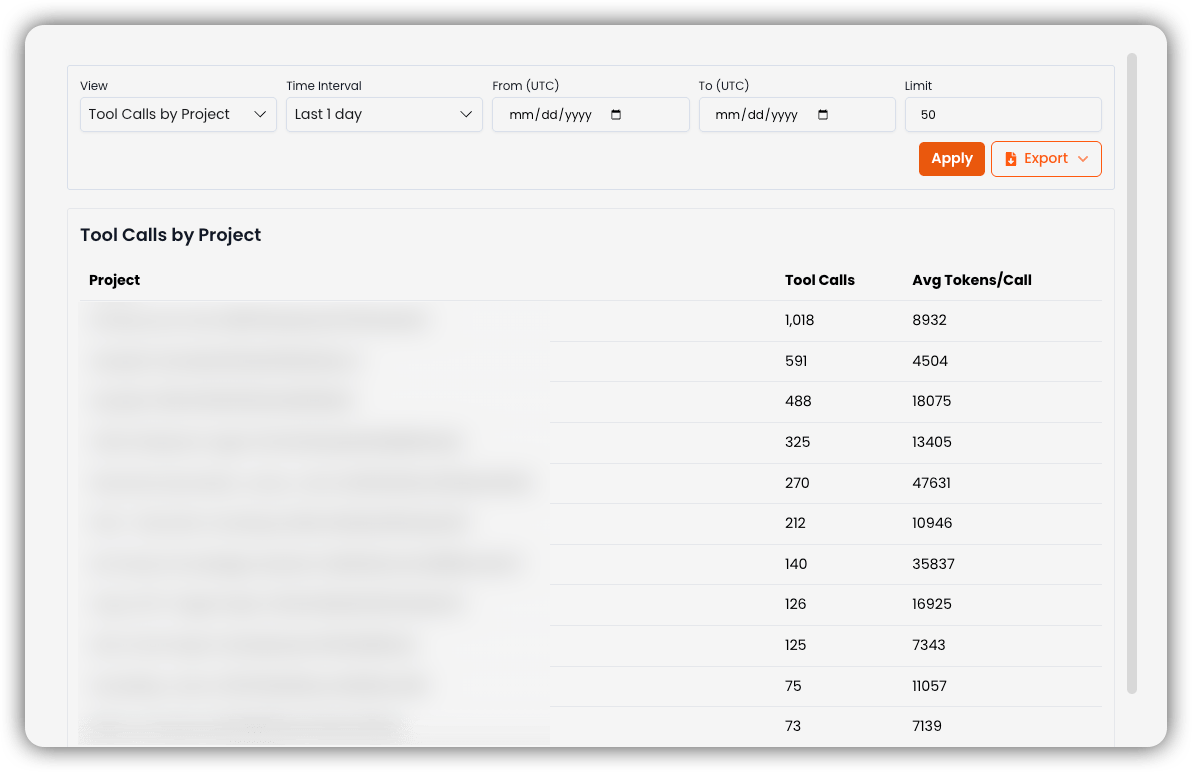
Tool Calls by Agent
Tool Calls by Agent lists each agent with Tool Calls and Avg Tokens/Call.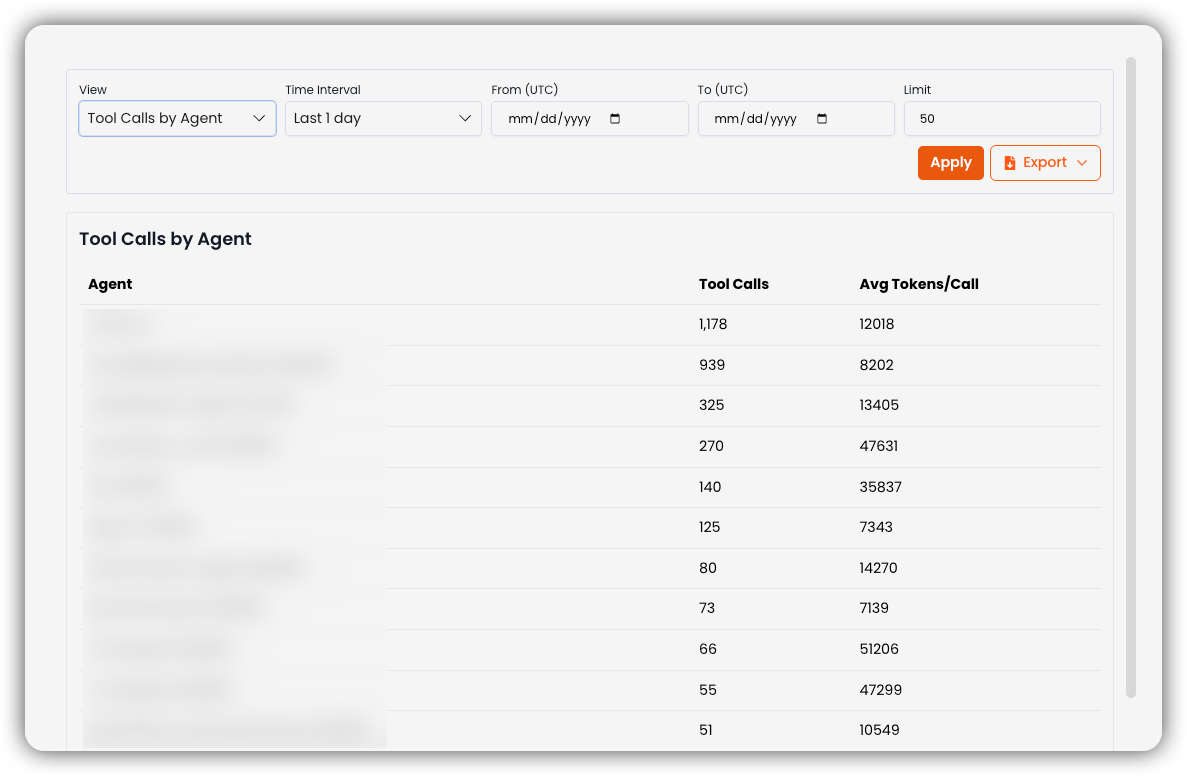
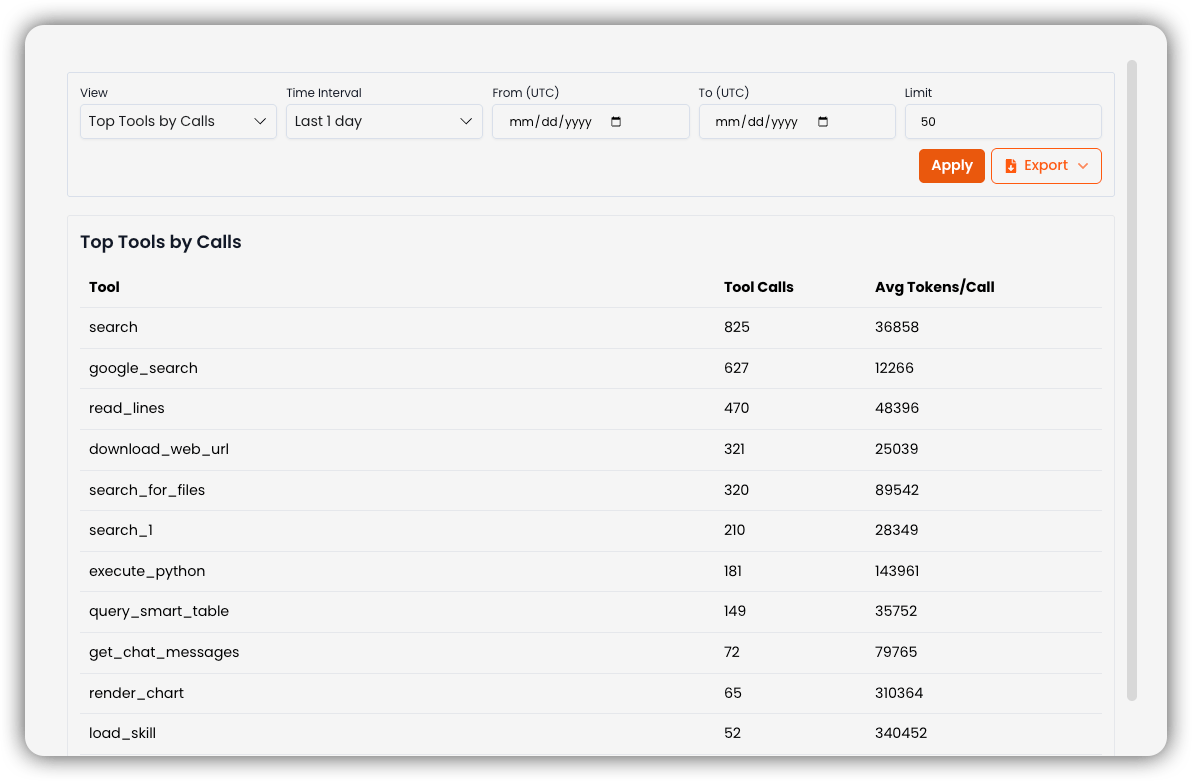
Top Tools by Calls
Top Tools by Calls ranks tools (for examplesearch, google_search) by how often they ran.
Related
- Credit Consumption — credit usage across the team and sub-teams
- Projects — credit allocation per project